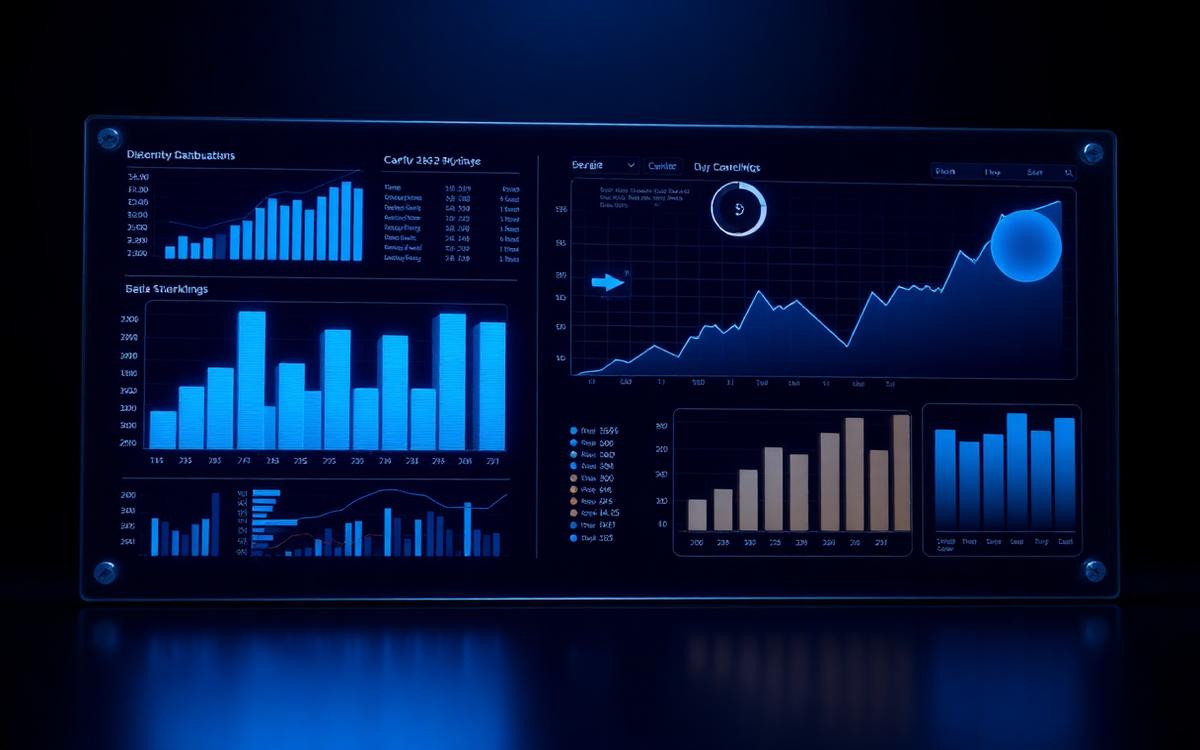
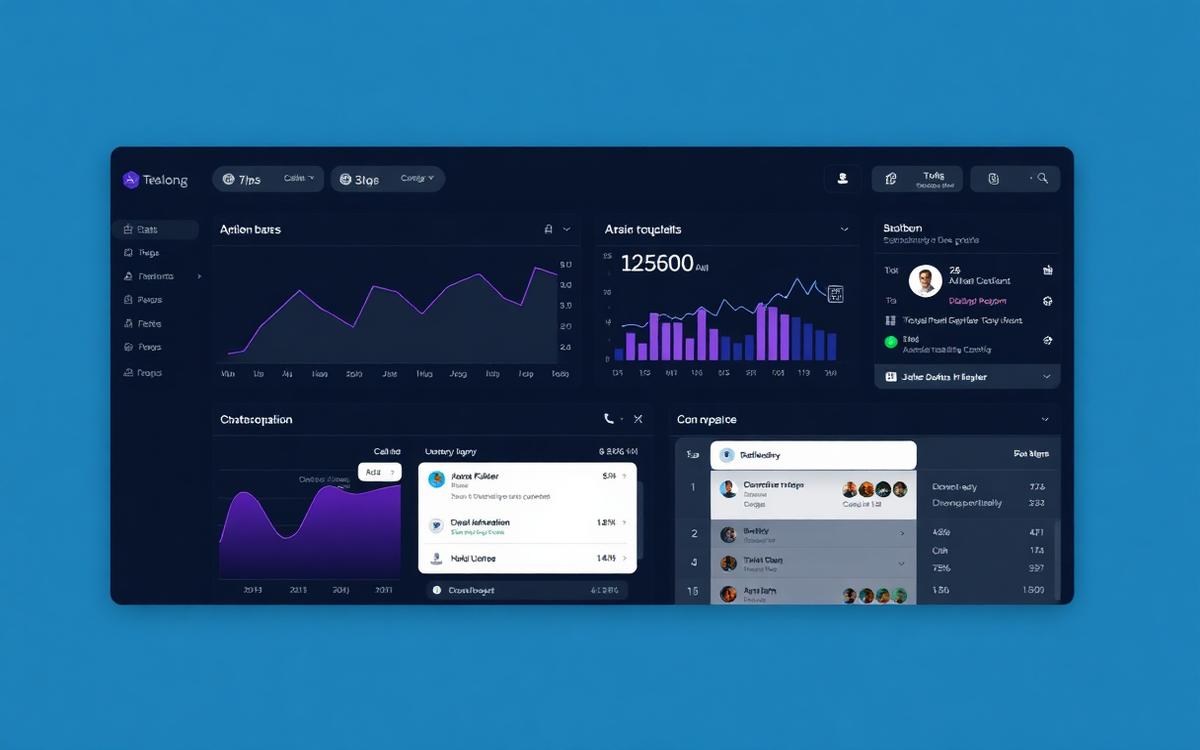
Multi-Branch Sales Analytics & BI Dashboard
A full-stack multi-branch sales analytics and business intelligence dashboard for a retail enterprise operating across 5 branches (3 in Hyderabad, 2 in Andhra Pradesh). Ingests raw transactional sales reports into PostgreSQL to deliver real-time KPI monitoring, P&L profit tracking, multi-granularity revenue analytics, tax liability audits, and salesperson leaderboards.
The problem
Managing raw billing reports across 5 separate store locations made it difficult to identify revenue drivers, evaluate store-level profitability, track tax liabilities, and monitor individual salesperson contributions. Manual spreadsheet analysis caused delayed financial reporting and lacked interactive drill-down filtering by product, category, store, date range, or price point.
Key features
- 5-Branch Regional Analytics: Aggregate or single-store breakdown comparing 3 Hyderabad stores and 2 Andhra Pradesh branches
- Executive KPI Layer: Real-time tracking of Total Revenue, Quantity, Total Bills, Avg Bill Value, Today's Revenue, and Month-to-Date (MTD) Sales
- Financial & Profitability Engine: Exact profit calculation (Net Amount − Cost Price), Avg Profit per Bill, Gross Margin, and COGS breakdown
- Tax Liability & Audit Module: Automated tracking of basic pre-tax amount, tax collected, tax-to-revenue ratio, and periodic tax summary reports
- Product & Category Intelligence: Top-performing product rankings, underperforming inventory flags, and category/department revenue distribution
- Salesperson Leaderboard: Performance tracking and commission-ready sales leaderboards ranked by net revenue and bill count
- Multi-Granularity Time Series: Hourly peak-time sales curve, daily performance, and monthly/yearly seasonal trend visualizations with Recharts
- CSV/XLSX Ingestion Pipeline: Express/Multer file ingestion service utilizing PapaParse and XLSX to parse and index billing exports into PostgreSQL
- Interactive Multi-Param Filter: Deep search and filter by store branch, category, product, salesperson, date range, and price bracket
Architecture
- 1Raw Billing CSV/XLSX Export → Express Ingestion Endpoint (Multer + PapaParse/XLSX)
- 2Node.js Data Cleaning & Schema Normalization → PostgreSQL (Indexed on Date, Branch, Category)
- 3Express REST API Endpoints → SQL Aggregations (KPIs, Profit, Tax, Leaderboard)
- 4React Query Data Fetching & Caching → State Management Layer
- 5React 18 + Recharts + Tailwind CSS UI → Interactive Executive Dashboards & Filters
Important functions
// Express REST Endpoint for Branch Financials & P&L Analysis
router.get("/api/analytics/financials", async (req, res) => {
  const { branchId, startDate, endDate } = req.query;
  const query = `
    SELECT
      branch_site,
      COUNT(DISTINCT transaction_id) AS total_bills,
      SUM(quantity) AS total_units_sold,
      SUM(net_amount) AS total_revenue,
      SUM(cost_price * quantity) AS total_cogs,
      SUM(net_amount - (cost_price * quantity)) AS gross_profit,
      ROUND(SUM(net_amount - (cost_price * quantity)) / NULLIF(SUM(net_amount), 0) * 100, 2) AS profit_margin_pct,
      SUM(basic_amount) AS total_pre_tax_amount,
      SUM(tax_amount) AS total_tax_collected,
      ROUND(AVG(net_amount), 2) AS avg_bill_value,
      ROUND(AVG(net_amount - (cost_price * quantity)), 2) AS avg_profit_per_bill
    FROM sales_data
    WHERE bill_date BETWEEN $1 AND $2
      AND ($3::text IS NULL OR branch_site = $3)
    GROUP BY branch_site
    ORDER BY total_revenue DESC;
  `;
  const result = await db.query(query, [startDate, endDate, branchId || null]);
  res.json(result.rows);
});import React from "react";
import { useQuery } from "@tanstack/react-query";
export const ExecutiveMetrics: React.FC<{ filters: FilterState }> = ({ filters }) => {
const { data: metrics, isLoading } = useQuery({
queryKey: ["sales-metrics", filters],
queryFn: () => fetchSalesMetrics(filters),
});
if (isLoading || !metrics) return <div className="animate-pulse h-48 bg-secondary/50 rounded-xl" />;
return (
<div className="grid grid-cols-1 md:grid-cols-4 gap-4">
<MetricCard title="Total Revenue" value={`₹${metrics.totalRevenue.toLocaleString()}`} change="+12.4%" />
<MetricCard title="Gross Profit" value={`₹${metrics.grossProfit.toLocaleString()}`} subtitle={`Margin: ${metrics.profitMarginPct}%`} />
<MetricCard title="Tax Collected" value={`₹${metrics.taxCollected.toLocaleString()}`} subtitle={`Tax Ratio: ${metrics.taxRatio}%`} />
<MetricCard title="Total Transactions" value={metrics.totalBills.toLocaleString()} subtitle={`Avg Bill: ₹${metrics.avgBillValue}`} />
</div>
);
};import multer from "multer";
import Papa from "papaparse";
import * as XLSX from "xlsx";
export async function processUploadedSalesReport(fileBuffer: Buffer, mimeType: string) {
let rawRows: any[] = [];
if (mimeType.includes("csv")) {
const text = fileBuffer.toString("utf-8");
rawRows = Papa.parse(text, { header: true, skipEmptyLines: true }).data;
} else {
const workbook = XLSX.read(fileBuffer, { type: "buffer" });
const sheetName = workbook.SheetNames[0];
rawRows = XLSX.utils.sheet_to_json(workbook.Sheets[sheetName]);
}
const normalizedData = rawRows.map(row => ({
transactionId: row["Bill No"] || row["Transaction ID"],
itemCode: row["Item Code"],
billDate: new Date(row["Bill Date"]),
productName: row["Description"] || row["Item Name"],
category: row["Category"],
subCategory: row["Department"],
salespersonName: row["Salesman"],
quantity: Number(row["Qty"] || 1),
costPrice: Number(row["Cost Price"] || 0),
basicAmount: Number(row["Basic Amt"] || 0),
taxAmount: Number(row["Tax Amt"] || 0),
netAmount: Number(row["Net Amt"] || row["Total Amount"]),
branchSite: row["Branch"] || row["Store Location"]
}));
await batchInsertSalesRecords(normalizedData);
}Simulation & screenshots